“Running a business without financial intelligence is like driving a car with a blacked-out windshield and only looking in the rearview mirror.”
– Keith Cunningham
Let’s be honest—most small business owners avoid looking at their financial statements. Why…? Mostly because they don’t know what they are looking at; they don’t know what to do with the numbers; and it feels like more of an ‘accounting’ thing for tax time.
Sound familiar? You’re not alone. Many business owners focus on cash in the bank and ignore their Profit & Loss Statement (P&L). But the problem is, if you don’t understand your numbers, you can’t make smart decisions—you’re just hoping for the best. And hope isn’t a strategy!
So, let’s break it down into simple, actionable insights that help you use your P&L to grow your business—without all that accounting jargon.

A profit roadmap for your business.
A P&L—also called an Income Statement—is a report that tracks your business’s income, expenses, and profit (or loss) for a set period of time (monthly, quarterly, or yearly). Think of it like a scorecard for your business…
It tells you if you’re winning (making money) or losing (bleeding cash).
It shows what’s working and what’s broken.
It helps you make smart financial decisions—so you’re not flying blind.
Your P&L follows a very simple formula:
Revenue (Sales) – Expenses = Profit (or Loss)

Five key pieces of information that give an honest picture of your performance.
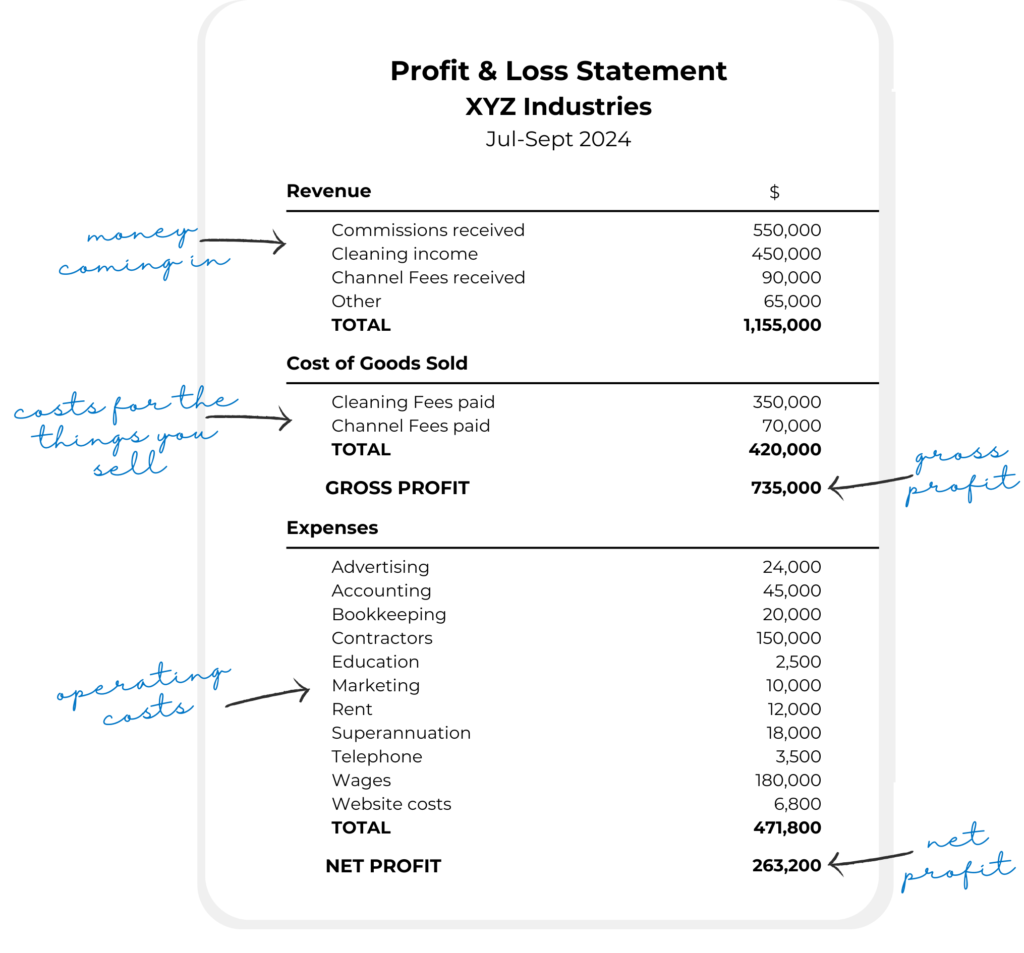
As we said above, a Profit & Loss (P&L) statement tells you whether your business is making money or losing it. And more than that, it breaks down your income, expenses, and profit over a set period of time, showing where your money comes from and where it’s going. By analysing your P&L, you can spot trends, identify problem areas, and make informed decisions to improve profitability. Specifically, on your P&L you’ll find…
Revenue
this is all the money coming in from the things you sell.
it’s a good idea to track all the different types of sales you are making (eg by different products or services) as this will help show what is most profitable.
Cost of Goods Sold
these are the direct costs tied to the things you sell (eg materials, supplier costs, direct labour etc)
it’s a good idea to separate these costs from other operational expenses.
Gross Profit
This tells you how much you are making before you add in any other operating costs (also called overheads)
This is how you monitor whether you have the right pricing strategy and/or if your direct selling costs are too high.
Operating Expenses
this is where we track all the other operational expenses. Things that you need to keep your business going but aren’t necessarily directly tied to making the product/service you sell.
these expenses are usually grouped into broad categories, but consider separating expenses in a meaningful way that will allow you to more easily track what’s going up or down.
Net Profit (the bottom line)
this tells us the final operating profit (or loss) after all the expenses.
keep in mind this is our profit before taxes are paid.


Spot trends, cut waste, boost profits.
A P&L Statement isn’t just a report that you glance at — it’s a tool for making smarter business decisions. But looking at a single period in isolation doesn’t always give you the full story. Trends over time matter more than just individual numbers.
To really understand how your business is performing, compare your P&L over time—this month vs. last month, this year vs. last year, or even quarter by quarter. These comparisons reveal patterns, highlight potential problems, and help you make proactive decisions instead of reactive ones.
What are we looking for?
The goal is to understand not only if you’re making a profit, but what is contributing to that bottom line. You’re looking to uncover trends in relation to revenue, profit margins, and expenses in order to reveal what’s working and what might need attention.
A healthy P&L would show sustainable growth, controlled costs, and strong profitability, while red flags like shrinking margins or rising expenses signal areas that need fixing. Let’s look at some key indicators for each area on the P&L…
When it comes to revenue, we want to know if our sales are going up or down or if the business is expanding or shrinking…
If revenue is going down, that’s a sign we should look more closely at sales trends, customer retention or possibly seasonal factors.
If revenue is growing, that’s a great sign. However, this alone doesn’t mean more profit. We also need to check closely whether the costs are also growing which might negate this increased revenue.
When it comes to cost of goods sold (COGS), we want to know how much it costs to produce/deliver our services…
If COGS is increasing, that is a good sign to review supplier costs to see if they are increasing or inefficiencies have crept in.
If COGS is going down then this might indicate you have improved efficiencies or negotiated better rates with suppliers.
When it comes to gross profit, this shows us the relationship between the sales and what it costs to deliver those sales…
If the gross profit is going down, this might indicate that your own pricing is too low to cover costs or that the costs are too high and you might need to seek alternatives or renegotiate.
If the gross profit is going up, this might indicate that your pricing strategy is working and/or you are getting more efficient in producing/delivering your products. When it comes to operating expenses (overheads), we want to know if we are spending more than necessary and reducing profits…
If operating costs are going up it could indicate that you are overspending on certain areas of your business. It can also indicate that costs are just increasing (with inflation or CPI). Can you reduce or eliminate some unnecessary costs or perhaps prices need to increase further to cover it.
If operating costs are going down then it could indicate that you are cutting unnecessary costs and operating more efficiently. One consideration is whether a lack of spending could also be stifling business growth.
When it comes to net profit, we want to know if we’re keeping any money after all the expenses…
If profits are going down (or worse, we’re making a loss) then it indicates expenses are eating into the gains – either income needs to go up or costs need to come down.
If profits are going up then it suggests that costs are being managed appropriately and any growth is sustainable. You may want to see if further efficiencies are possible to increase the profit further.
Other key things to consider…
How much money are you spending on advertising and marketing? If you are spending more but sales are flat (or going down) then it might be ineffective. On the flip side, if your advertising spend is stable or decreasing but sales are still climbing then your efforts might be becoming more efficient.
How much are you spending on payroll? If your payroll costs are going up faster than the sales, you may be overstaffed. On the other hand, if payroll is decreasing and sales are stable or going up, your workforce might be more efficient. You should also take into account whether you are paying yourself the right amount (and not more than your business can afford) as well as considering timing factors, particularly if you are adding resources in preparation for growth.
How much are you paying for subscriptions & software? Tools change over time and we tend to add additional software without cancelling the things we are no longer using. Regularly monitor these costs to avoid paying for things you don’t need.

Garbage in, garbage out.
Your Profit & Loss statement is only as good as the data going into it. If your records are inaccurate, incomplete, or messy, your P&L won’t give you reliable insights—just bad data leading to bad decisions.
Here’s a few ways to get the most our of your P&L:
Keep your bookkeeping up to date and don’t let transactions pile up. Keeping your records updated regularly (at least weekly or monthly) ensures your P&L reflects real-time business performance, helping you catch issues early rather than scrambling at tax time.
Categorise your expenses correctly and consistently (e.g., rent, advertising, wages). Misallocating expenses can lead to inaccurate reports, missed deductions, and confusion when analysing profitability. If you don’t know what you’re doing – get an expert to help you.
Reconcile your bank accounts regularly. Your P&L is only useful if it reflects actual cash flow. Reconciling your bank accounts ensures that every transaction is recorded correctly, preventing missing income, duplicate expenses, or errors that could throw off your reports.
Track your revenue properly and ensure income is recorded in the correct period. If you invoice clients in December but don’t receive payment until January, your revenue might be understated for one period and overstated in another, leading to misleading financials.
Be careful of automations and integrations. Accounting tools like Dext or Hubdoc can automate data entry, reducing errors and saving time. But make sure integrations are set up correctly—duplicate entries or incorrect mappings between software can create more problems than they solve.
Review reports consistently and don’t wait until the end of the year to check your numbers. Set a habit of reviewing your P&L monthly (or even weekly) to track trends, compare against past performance, and adjust your strategy before small issues become big problems.
You don’t have to do it alone…Wingr is here to provide as much support as you need along your business journey.
Understanding your financial information is critical to business success. If you are looking for more guidance and support to review and monitor your business’ performance, we can help.
We offer regular monthly advisory sessions to keep you accountable and offer that one-on-one support to help you focus on growth in your business.
Reach out today to get the ball rolling…
